Interactive apps in ScheldeMonitor

ScheldeMonitor provides a collection of interactive applications that allows users to transform data sets into comprehensible graphs and figures. The applications of ScheldeMonitor were created using R programming. Additionally, this page highlights several applications created by partners or providers of ScheldeMonitor.

ScheldeMonitor RShiny applications

These applications are created and maintained by VLIZ, using R and RShiny programming. Visitors can use the apps to interactively create graphs and figures about nutrients, water levels, wave levels and species distribution in the Scheldt estuary. The apps are momentarily only available in dutch, but will receive an english version in 2021.

Afbeelding
Nutrients in het Scheldt estuary

Nutrients in het Scheldt estuary

Access App
Afbeelding
Water levels in the Scheldt estuary

Water levels in the Scheldt estuary

Access App
Afbeelding
Wave levels in the Scheldt estuary

Wave levels in the Scheldt estuary

Access App
Afbeelding
Species distribution in the Scheldt estuary

Species distribution in the Scheldt estuary

Access App
Afbeelding
Pollutants in the Scheldt estuary

Pollutants in the Scheldt estuary

Access App
Afbeelding
Sediments in the Scheldt estuary

Sediments in the Scheldt estuary

Naar App

Interactive applications by partners and providers

Aside from the application made for ScheldeMonitor, many partners, providers and relevant institutions have made applications, viewers and tools available that interactively provide data products and maps that are relevant for the Scheldt estuary. This overview provides links to those external sources.
Afbeelding
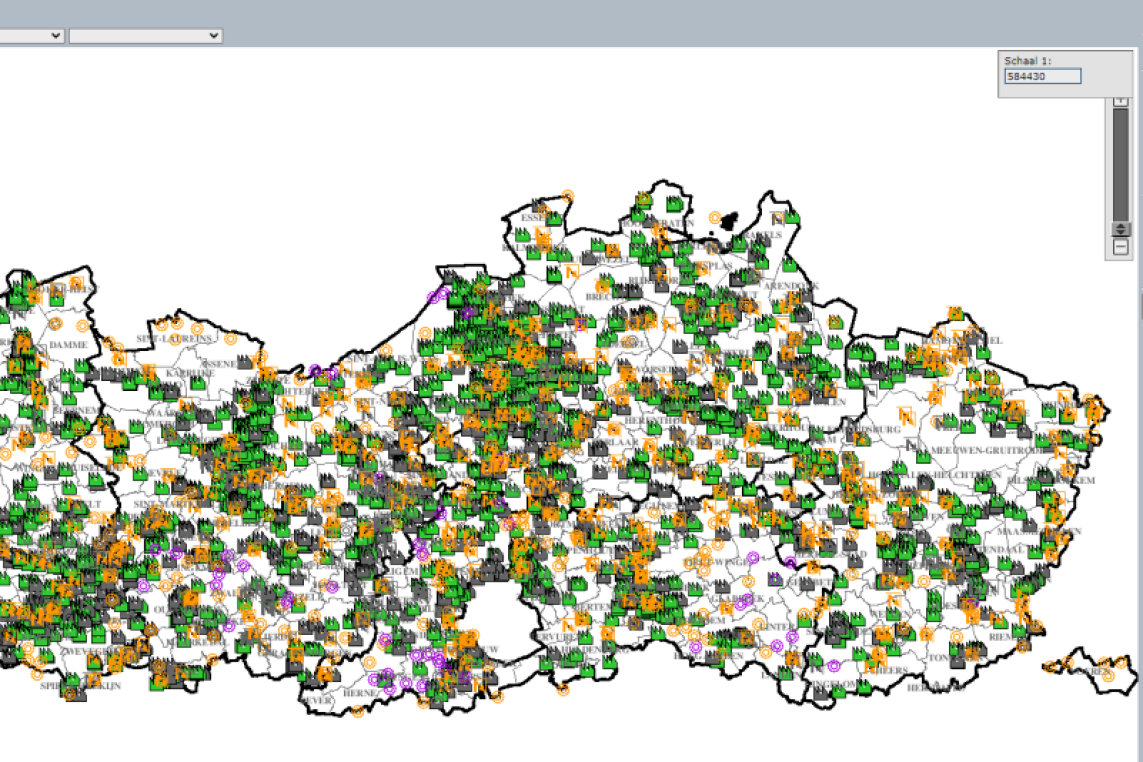
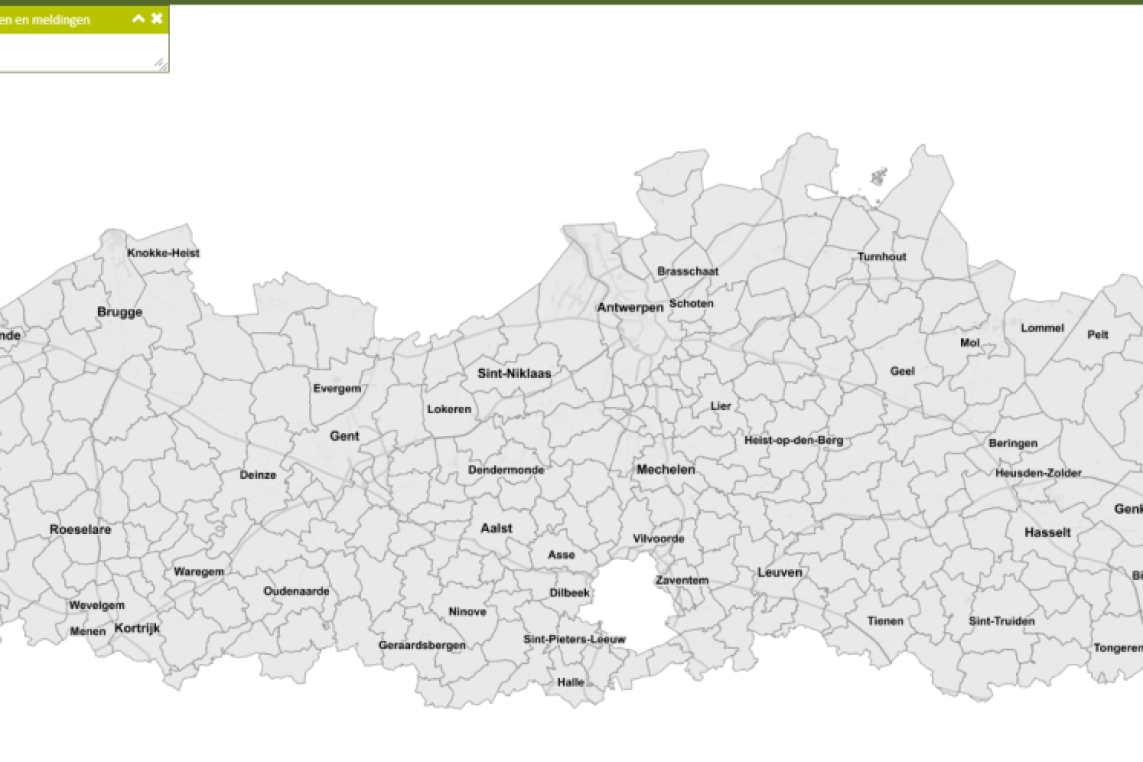
geoloket ovam printscreen

Geoloket bodemonderzoek en sanering

Source: OVAM

Access Viewer
Afbeelding
printscreen integraalwaterbeleid

Geoloket stroombeheersplannen

Source: Coördinatiecommissie Integraal Waterbeleid

Access Portal
Afbeelding
printscreen geopunt

Geopoint Flanders

Source: Agentschap Informatie Vlaanderen

Access Viewer
Afbeelding
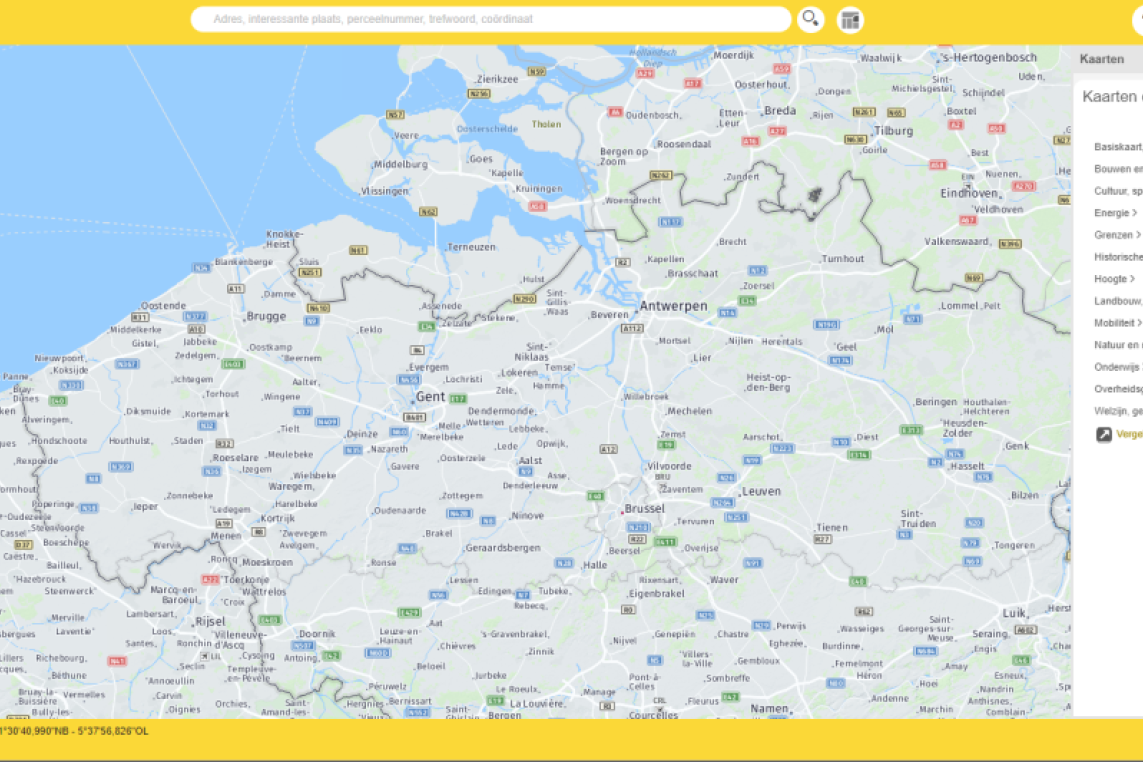
printscreen geoloket

Geoloket VMM

Source: Vlaamse Milieumaatschappij

Access Viewer
Afbeelding
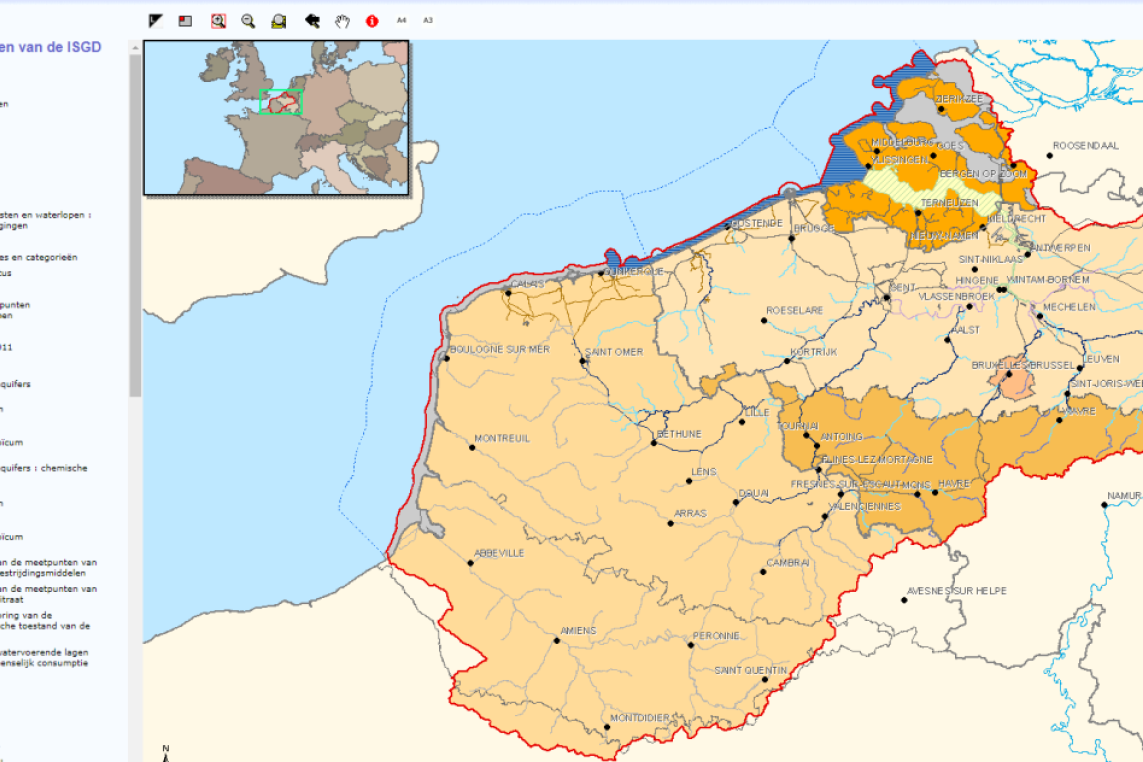
ISDG

Internationaal Stroomgebiedsdistrict van de Schelde

Source: Scaldit

Access Viewer
Afbeelding
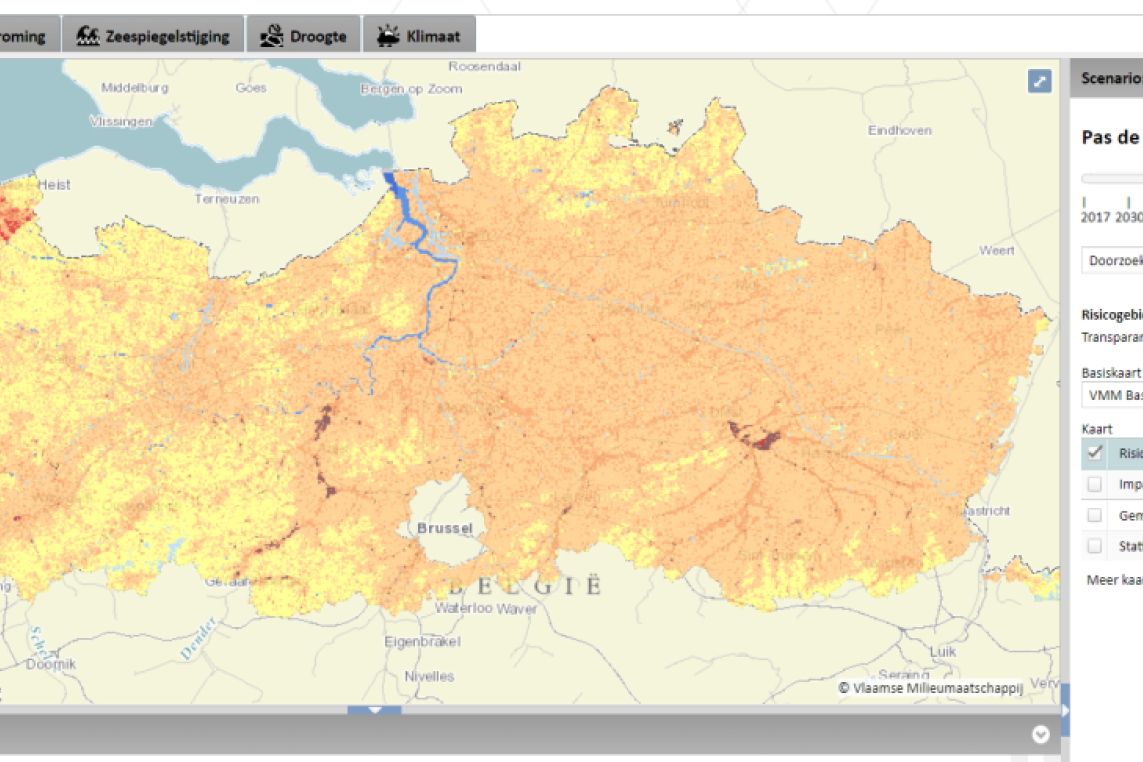
printscreen klimaatportaal

Climate Portal Flanders

Source: Vlaamse Milieumaatschappij

Access Portal
Afbeelding
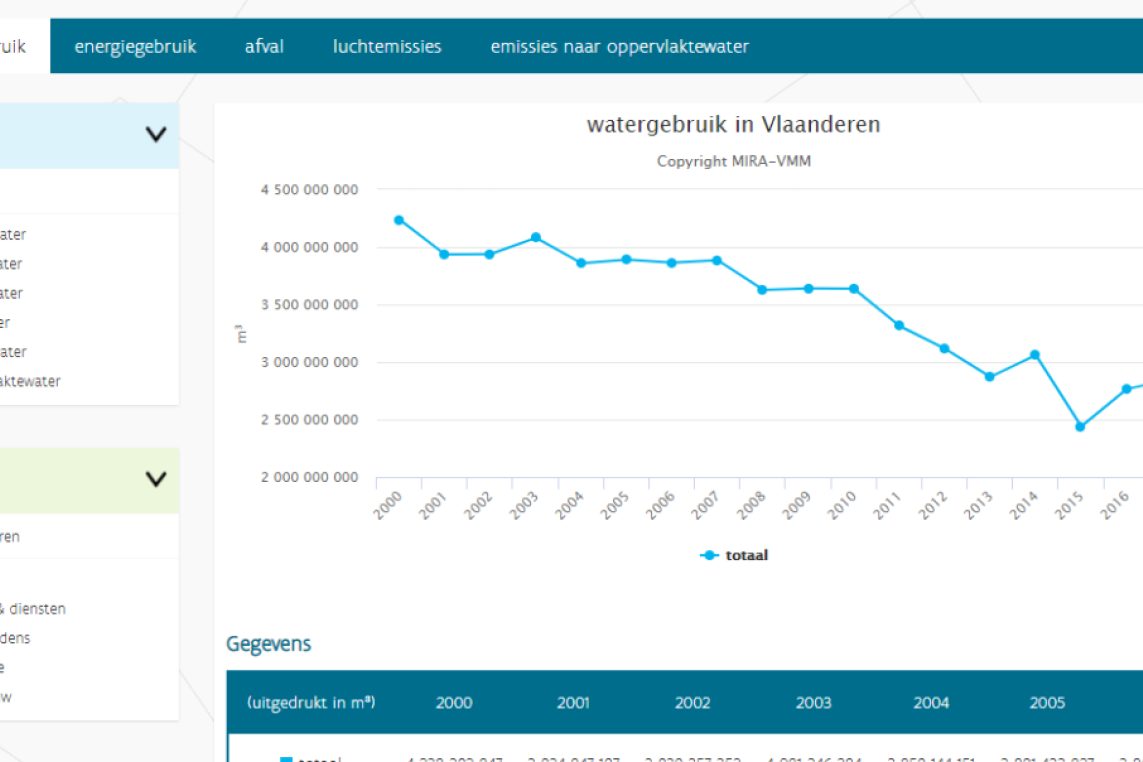
printscreen milieudata

Environmental data Flanders

Source: Vlaamse Milieumaatschappij

Access App
Afbeelding
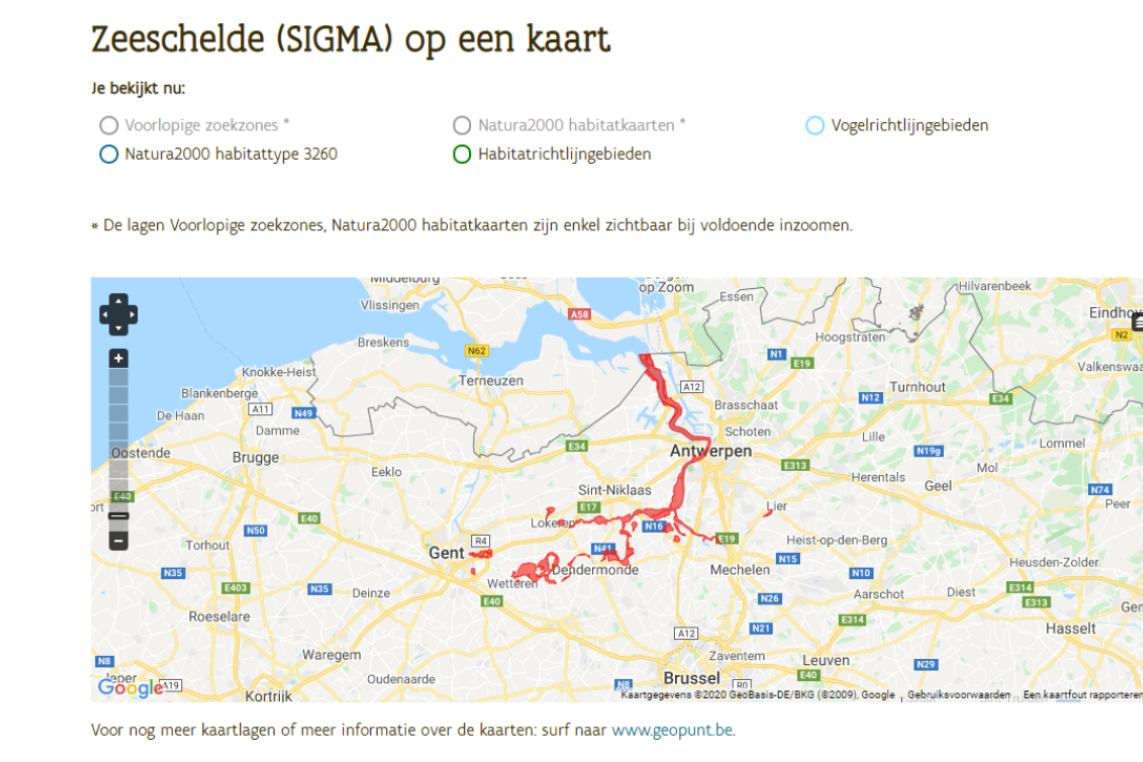
printscreen natura2000 app

Natura2000 areas in SIGMA-plan

Source: Natura2000 Vlaanderen

Access Viewer
Afbeelding
printscreen natuurindicatoren

Nature indicators

Source: Instituut voor Natuur- en Bosonderzoek 

Access Portal
Afbeelding
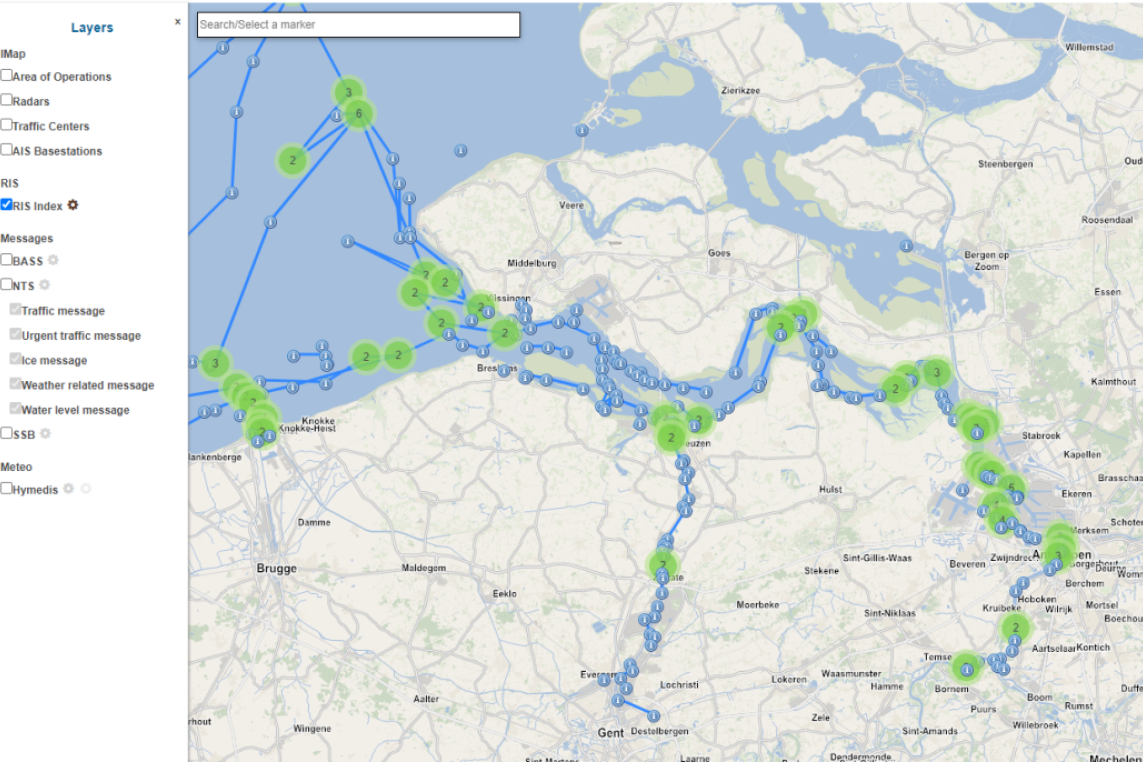
printscreen vtsscheldt

Shipping traffic Westerschelde

Source: VTS-Scheldt

Access Viewer
Afbeelding
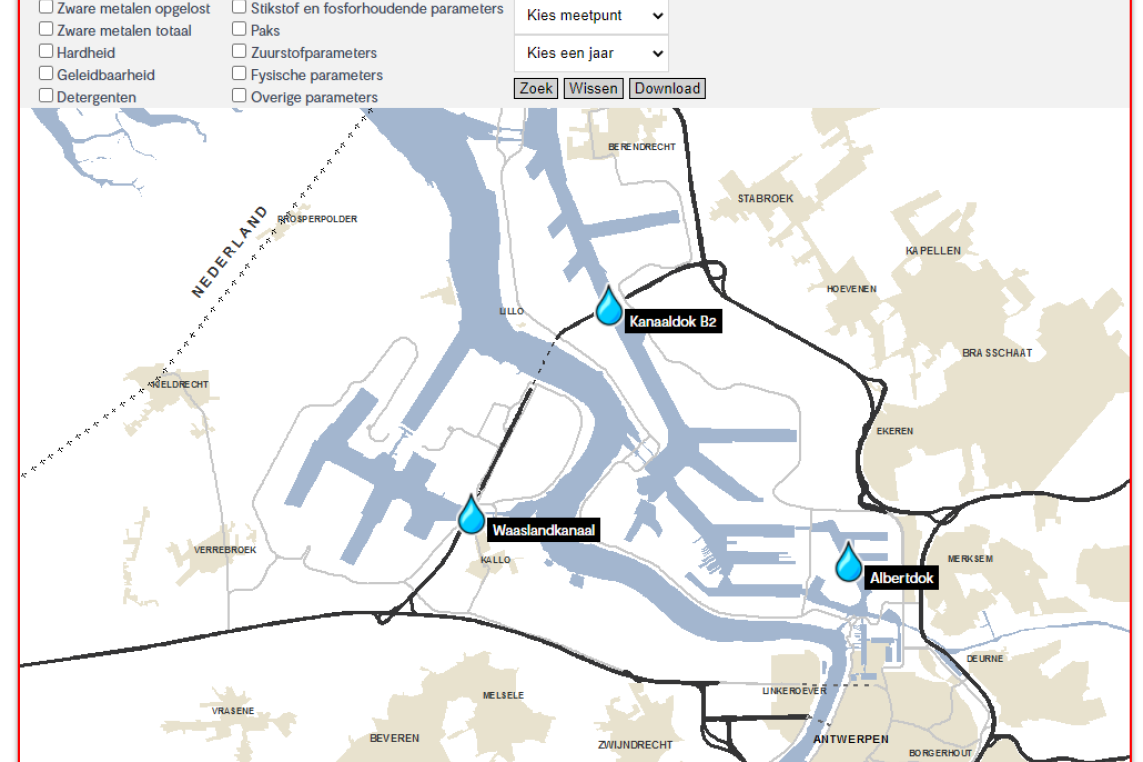
printscreen waterkwaliteit

Water quality Port of Antwerp

Source: Port of Antwerp

Access Viewer
Afbeelding
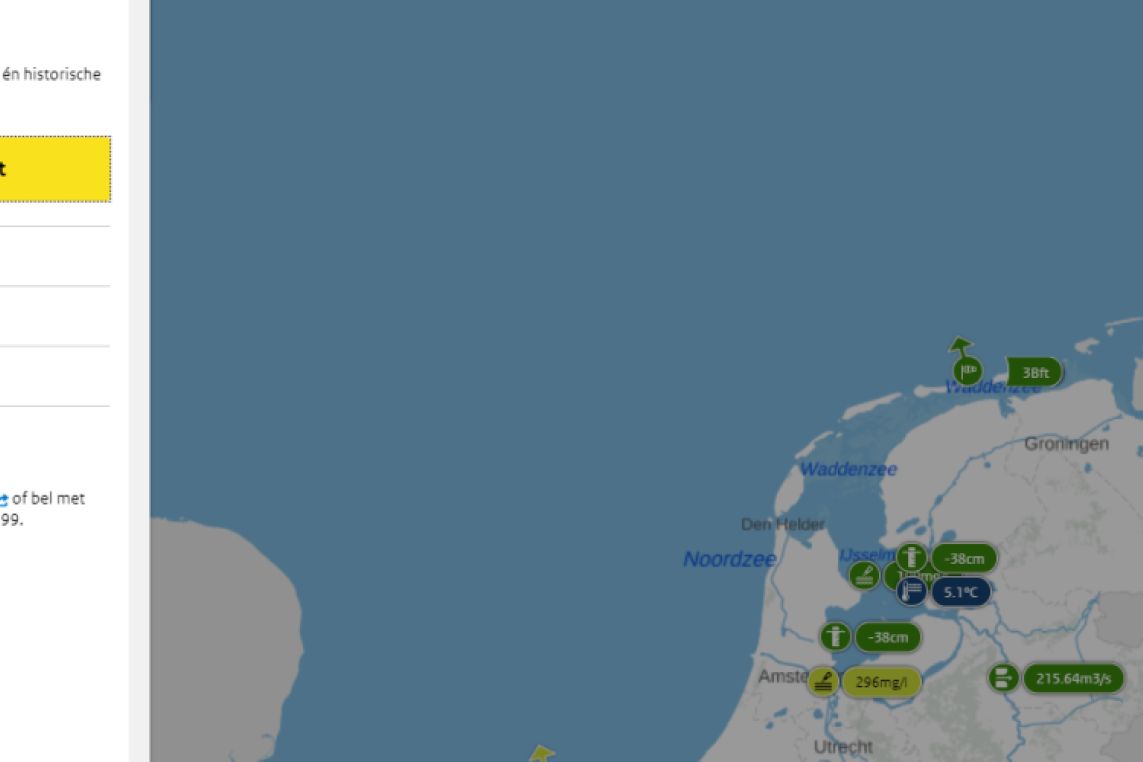
waterinfo nederland printscreen

Water info The Netherlands

Source: Rijkswaterstaat

Access Portal
Afbeelding
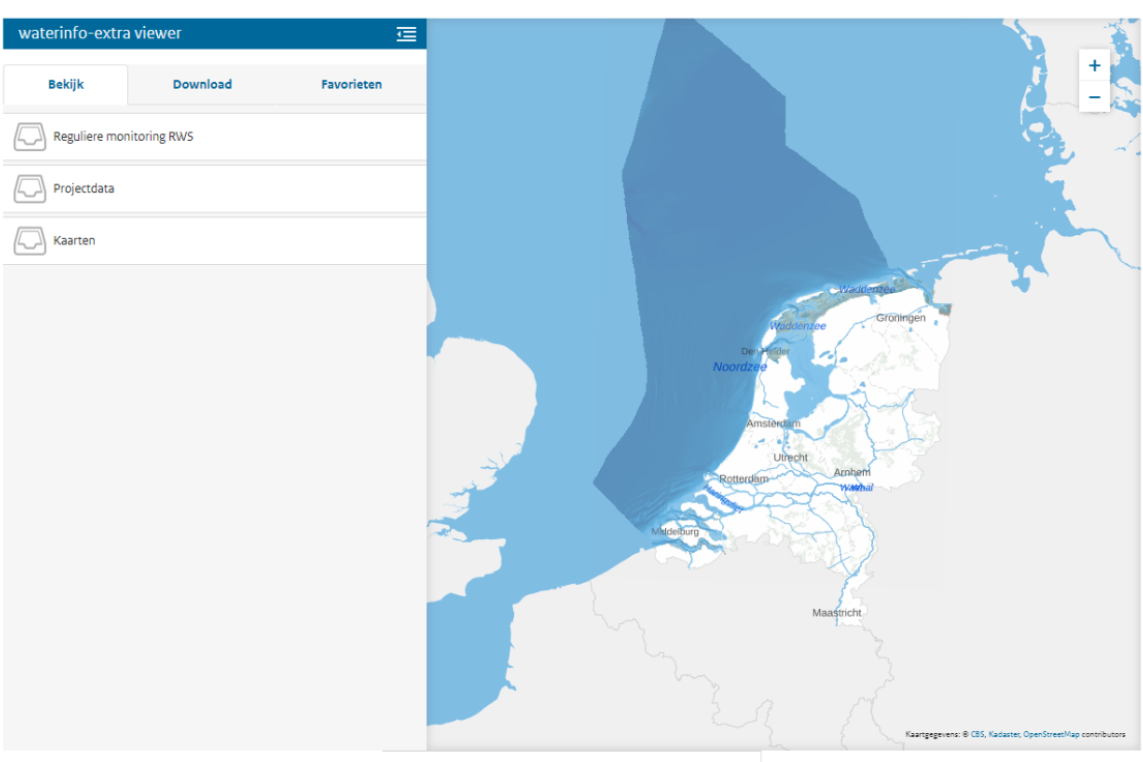
printscreen waterinfo

Waterinfo Nederland extra

Bron: Rijkswaterstaat

Naar Viewer
Afbeelding
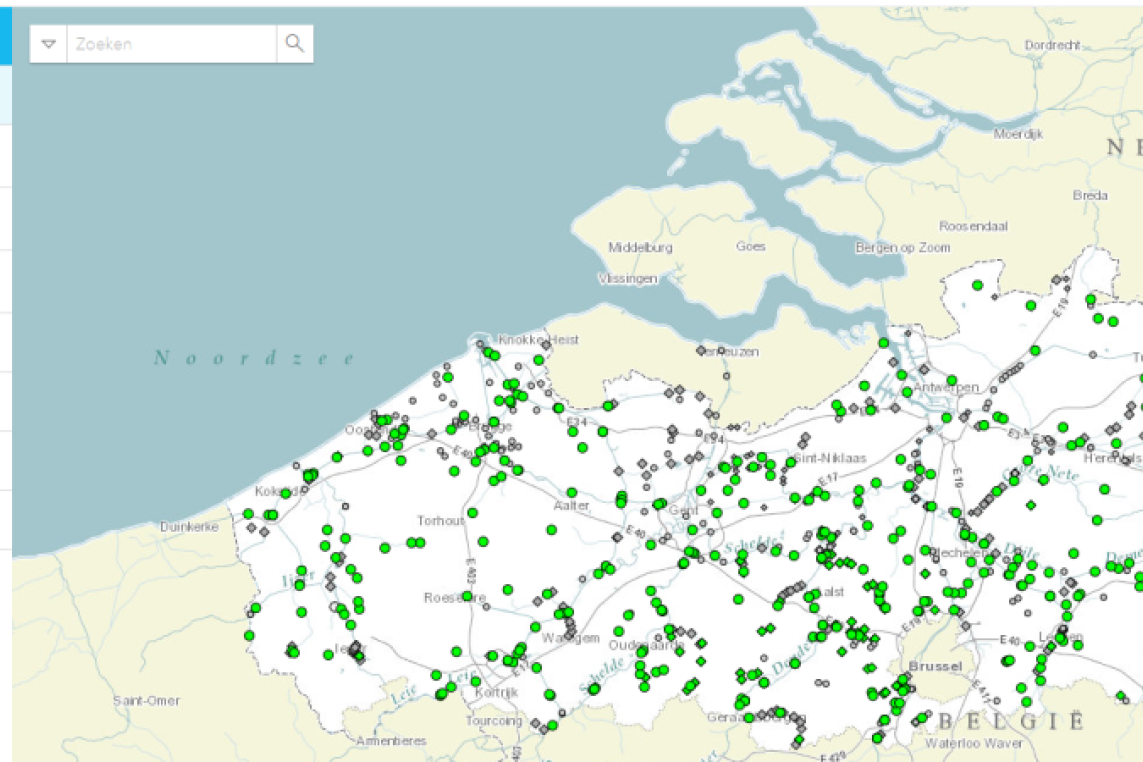
waterinfo.be printscreen

Water info Flanders

Source: Waterinfo.be

Access Portal
Afbeelding
printscreen deltares app

Water quality Westerschelde

Source: Deltares & Rijkswaterstaat

Access App